- انتخاب شما آغاز تعهد ماست . . .
- تهران: 02176490358 - 09120613870
- مشهد: 05138554285 - 09155177027
- info@PersianCode.net
spatial filtering روش های فیلترینگ مکانی متلب
با توابع fspecial – Gaussian – Disk – Average در متلب
آموزش برنامه نویسی در متلب 5
نوشته ها :
1- مراحل spatial filtering
2- کار با اپراتور correlation
3- آشنائی با اصطلاحات symmetric , replicate , circular
4- چگونگی دوران ماتریس
5- توابع fspecial
6- آشنایی با تابع Disk
7- آشنایی با تابع Average
8- آشنایی با تابع Gaussian
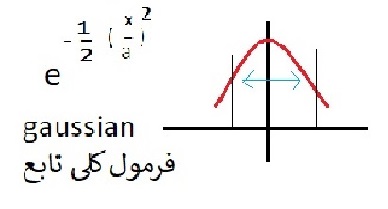
9- فرمول کلی تابع
10- تعریف اجیتکشن
11- تعریف بند ریجکت
مراحل فیلترینگ مکانی ، یا فضائی یا spatial filtering در نرم افزار متلب :
1- شروع کار با مختصات (x, y ) نقطه ای از تصویر در متلب1و1 تا آخر .
2- کار های مربوط به فیلتر مکانی تابع را روی نقطه (x, y ) آغاز میکنیم .
3- عددی را که در مرحله 2 به دست آوردیم در مختصات نقطه (x, y ) قرار میدهیم .
4- این 3 مرحله را روی نقطه بعدی تکرار میکنیم تا تمام شدن همه نقاط تصویر .
یک تصویر بنام M . N داریم مبدا مختصات (x, y ) عدد 1و1 است با در نظر گرفتن 8 نقطه همسایه انگار یک ماتریس [3 3] داریم عملیات خطی متناظر با آن را اجرا میکنیم و سراغ نقطه بعد میرویم .
یک به یک با عدد متناظرش ضرب و با هم جمع میشوند .
در ریاضی :
با فیلتر خطی مکانی مختصات همه نقاط (x, y ) را به دست میاوریم که از اپراتورهای پایه با ابعاد فرد میباشد که به آن Linear Spatial Filter کویند .
شکل کلی باز شده فرمول :
در ریاضی اپراتور convolution قرینه correlation میباشد .
دوران 180 درجه ای w .
تابع خطی im filter مجری تابع correlation در متلب میباشد .
ضرب متناظر اعداد در ماتریس [3 3]
بررسی توابع fspecial – Gaussian – Disk – Average در متلب
میانگین نویز را کم میکند و تصویر را اسموس میکند .
-
Clc ;
Clear ;
Close all ;
Img 1 = imread ( ‘ rice . png ‘ ) ;
A = 1 ;
W = ones ( 2 * a + 1 ) ;
W = w / sum (w ( : ) ) ;
img 2 = imfilter ( img 1 , w ) ;
figure ;
subplot ( 1 , 2 , 1 ) ;
imshow ( img 1 ) ;
title ( ‘original Image ‘ ) ;
subplot ( 1 , 2 , 2 ) ;
imshow (img 2 ) ;
title (‘ After Average Filter ‘ ) ;
باعث مات شدن تصویر شد ، اندازه a زیادتر کنیم ماتی تصویر بیشتر میشود .
به بررسی حواشی تصویر میپردازیم :
فیلتر circular با تکرار نقطه آخر ستون یا سطر حاشیه را کامل میکند
فیلتر symmetric با تقارن حاشیه را تکمیل میکند
فیلتر replicate با تکرار نقاط ثابت حاشیه تصویر را شکل میدهد .
جدا از این سه روش میتوان با جایگزین کردن عدد ثابت به حاشیه تصویر برسیم .
یک حاشیه تیره ای اطراف تصویر مات ایجاد شده .
با فیلتر symmetric حاشیه تیره تصویر را برطرف میکنیم .
برای افزودن به آخر یا اول تصویر از دو روش تابع Output Size Options استفاده میکنیم .
same به میزان تصویر اصلی full همه را کامل نمایش دهد .
-
Img 1 = imread (‘ rice . png ‘ ) ;
A= 15 ;
W= ones ( 2* a + 1 ) ;
W=w / sum ( w ( : ) ) ;
Img 2 = imfilter ( img , w , ‘ circular ‘ , ‘ full ‘ ) ;
Figure ;
Subplot ( 1 , 2 , 1) ;
Imshow ( img 1 ) ;
Title ( ‘Original Image ‘ ) ;
Subplot ( 1 , 2 , 2 ) ;
Imshow ( img 2 ) ;
Title ( ‘ After Average Filter ‘ ) ;
ترکیب ماتریس با دو روش corr و conv ، با دوران ماتریس تغییری حاصل نمیشود دستور العمل این دو یکی است .
با دوران جهت یک عملکرد را تغییر میدهیم ، حتی جهت افقی عمودی را .
تابع fspecial با فیلتر های اتو مات میتواند ماتریس را بسازد .
-
fspecial average
Clc ;
Clear ;
Close all ;
Img 1 = imread ( ‘ rice . png ‘ ) ;
W = fspecial ( ‘ average ‘ , [ 1  10 ] ) ;
Img 2 = imfilter ( img 1 , w , ‘ circular ‘ ) ;
Figure ;
Subplot ( 1 , 2 , 1 ) ;
Imshow ( img 1 ) ;
Title ( ‘ Original Image ‘ ) ;
Subplot ( 1 , 2 , 2 ) ;
Imshow ( img 2 ) ;
Title ( After Average Filter ‘ ) ;
شکل افقی ستون ها خراب میشود .
ترکیب شدن صدا با متغیر فبل یا بعدش در بُعد زمان را اِکو میگوییم .
برای بازیابی تصویر مخدوش شده باید از روش های حذف پیچیدگی استفاده کنیم .
از توابع فوق برای ساخت نرم افزار دوربین پلاک خوان و استفاده در نرم افزار کنترل تردد پارکینگ خودرو ، سیستم اتوماسیون پارکینگ خودرو استفاده میشود. بیشترین استفاده نرم افزار پلاک خوان در اتوماسیون پارکینگ هوشمند میباشد.
همه توابع Average – Disk – fspecial – Gaussian به روش خاص خود پیچیدگی را برطرف میکنند .
Disk یا گردی:
-
>> w = fspecial ( ‘ disk ‘ , 50 ) ;
>> max ( w ( : ) )
Ans =
1.2732 e – 04
>> 1 / max ( w ( : ) )
Ans =
7.8540 e + 03
>> w = w / max ( w ( : ) ) ;
>> imshow ( w )
تصویر گرد با حواشی نرم حاصل دستور العمل بالا ست این دیسک میانگین وزنی دارد اما وزنش صفر است .
اثر گذاری دیسک تا شعاع خاصی است .
-
Clc ;
Clear ;
Close all ;
Img 1 = imread ( ‘ rice . png ‘ ) ;
R = 3 ;
Wa = fspecial ( ‘ average ‘ , 2 * r + 1 ) ;
Wd = fspecial (‘ disk ‘ ,r ) ;
Img 2 = imfilter (img 1 , wa , ‘ circular ‘ ) ;
Img 3 = imfilter ( img 1 , wd , ‘ circular ‘ ) ;
Figure ;
Subplot ( 1 , 3 , 1 ) ;
Imshow ( img 2 ) ;
Title ( ‘ After Average Filter ‘ ) ;
Subplot ( 1 , 3 , 2 ) ;
Imshow ( img 3 ) ;
Title ( ‘ After Disk Filter ‘ ) ;
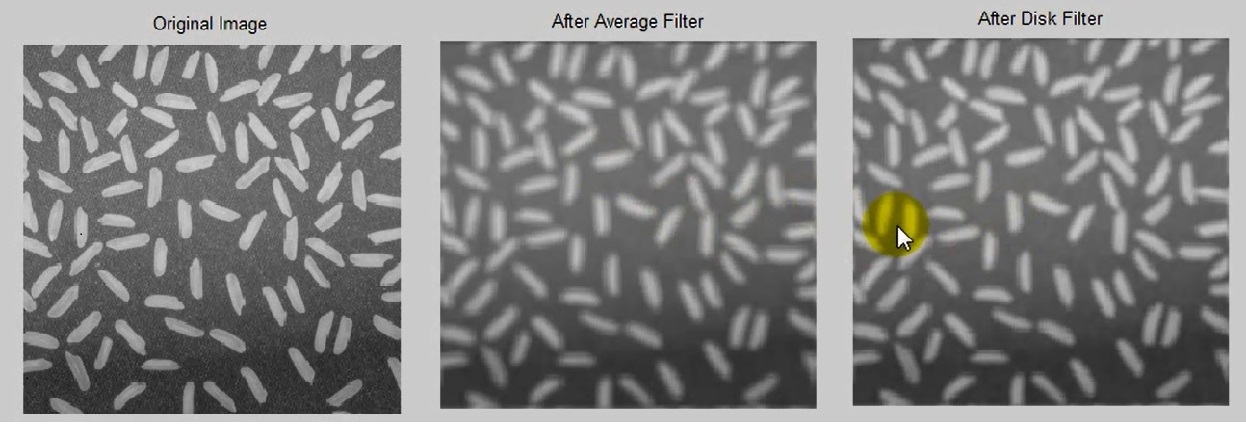
Average با تاثیر بر نقاط دور موجب مات وکدر شدن تصویر میشود ، در disk وضوح تصویر بالاست .
در یک تصویر برفکی همه نوسان ها موجود است ، بزرگترین فرکانس تصویر با رنگ ثابت صفر است .
فیلتر پایین گذر فقط فرکانس های پایین را از خود رد میکند ، این فیلتر تصویر را تار و رنگ و نور شدید را رد نمیکند .
وقتی رنگ در فرکانس های بالا تغییر میکند خط سفیدی بین پیکسل ها درست میشود که به آن اجیتکشن گویند .
درتابع های fspecial وقتی تغییرات شدید نباشد از فیلتر میان گذر برای عبور قسمت خاصی از فرکانس استفاده میکنیم .
زمانی که فقط فرکانس های خیلی بالا یا خیلی پایین را رد کنیم بند ریجکت کردیم .
توابع Average و disk و Gaussian جزئ فیلترهای پایین گذر متلب به حساب میایند .
وقتی پراکندگی بیشتر باشد نمایش تصویر پهن تر است .
-
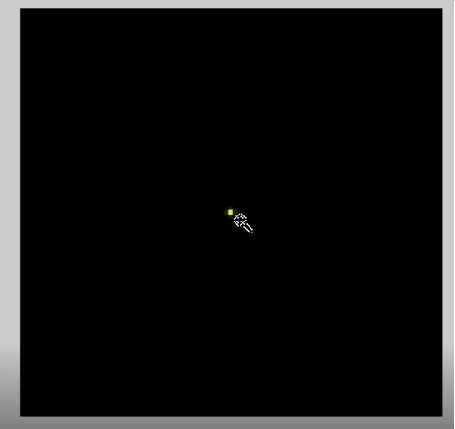
>> fspecial ( ‘ Gaussian ‘ , 101 ) ;
>> w = fspecial ( ‘ Gaussian ‘ , 101 ) ;
>> w =  w \ max ( w ( : ) ) ;
>> imshow ( w )
این نقطه نوک تیز بودن تصویر را نشان میدهد که به خاطر افت سریع آن است .
-
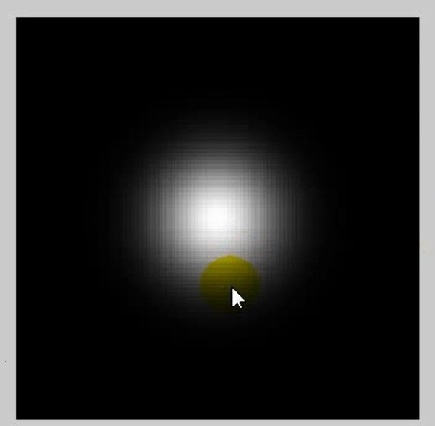
>> w = fspecial ( ‘ Gaussian ‘ , 101 , 10 ) ;
>> w = w \ max ( w (  : ) ) ;
> imshow ( w )
وزن زیاد باعث عملکرد نرم فیلتر و نورانی تر شدن تصویر میشود .
ادامه در مبحث6


